Sunday, January 14, 2007
Tuesday, January 09, 2007
Circle Geometry: Perpendicular Bisector/ Centre


Friday's class was homework correction and exam review. On Monday I was out, and the substitute went over more review.
Today, we used paper folding to show the following two statements:
The perpendicular bisector of a chord passes through the center of a chord.
A line connected to the center of the circle and the midpoint of a chord is perpendicular to the chord.
These statements are essentially converses of each other, and we rewrote them using "iff".
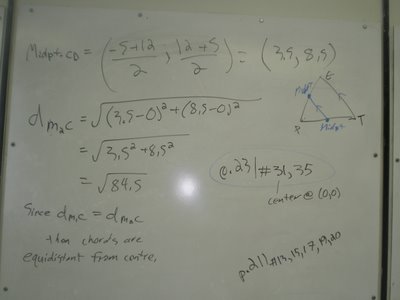
We also looked at applying the slope, midpoint, and distance formulas to circles and chords.
Homework 1st period: p.211 #13,15,17,19,20 (completed and corrected in class)
Homework 2nd period: p.231 #31,35
Thursday, January 04, 2007
Wednesday, January 03, 2007
Sunday, December 10, 2006
Monday, November 27, 2006
TEST WED
Reviewed the solutions to the provincial exam for January 2005. If you are looking for further review, the questions on exponentials and logarithms from June 2005 would be a good place to start; they are available on the sidebar. The blue study guide also contains some good info.
Thursday, November 23, 2006
Logarithms and Word Problems


We will be concluding logarithms on Friday by correcting a few more word problems dealing with logarithms.
The key to tackling these questions is to change the words into an exponential function in the form y=ab^(x/n). A few points of advice:
- If you're getting caught up on the terminology, making a table of values is a very good strategy. Write down the first two or three terms, then use this information to find the equation y=ab^(x/n)
- be careful with levels of interest; remember that when something doesn't change the base is 1. So if you are gaining 8% interest the base will be (1+0.08) or (1.08). Similarly, if something is depreciating by 10% then the base will be (1-.10) or (0.9).
- Your base should NEVER be negative in the scope of these questions, so if you have a negative number as the base you messed up somewhere.
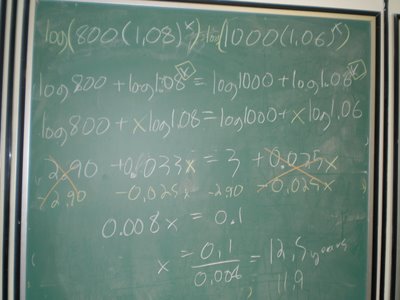
 From here you have two options: you can either work the problem out using the laws of logarithms (you have an unknown in the exponents and the bases cannot be made equal, so use logarithms). Please use more significant figures than I did -_- (4 would be sufficient)
Or you can graph the intersection points between the two graphs. If you choose to do this, the board below shows how much work would be required on the provincial exam (you have to play with your window settings a bit on the calculator to get a nice picture)
 Homework is the Multiple Choice questions from the January 2005 Provincial exam handed out in class, (10-18).


